FIG. 5.
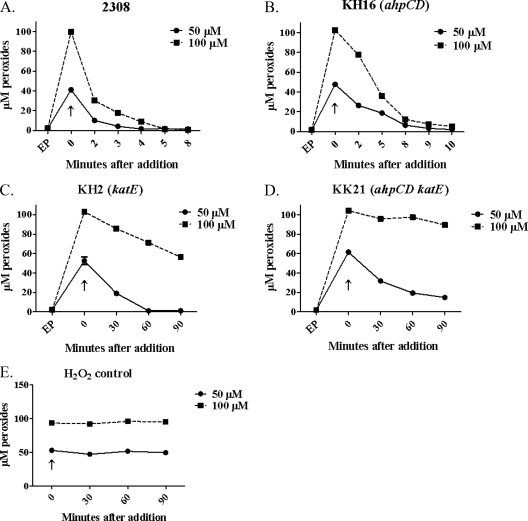
KatE is the predominant detoxifier of 50 and 100 μM exogenous H2O2 in B. abortus 2308. Shown are the levels of peroxides present in B. abortus 2308 (A), KH16 (B), KH2 (C), and KK21 (D) cell suspensions at selected times following the addition of 50 μM (solid lines) and 100 μM (dashed lines) H2O2. Panel E shows levels of H2O2 detected in cell-free test medium at selected time points following the addition of 50 μM (solid lines) and 100 μM (dashed lines) H2O2. The data presented here are representative of multiple (≥3) experiments performed from which equivalent results were obtained. “EP” denotes the levels of endogenous peroxides detected prior to the addition of the H2O2; “↑” denotes the levels of intracellular peroxides detected immediately after the addition of the H2O2. Note that the time points after addition of the H2O2 differ for some of the panels in this figure.

