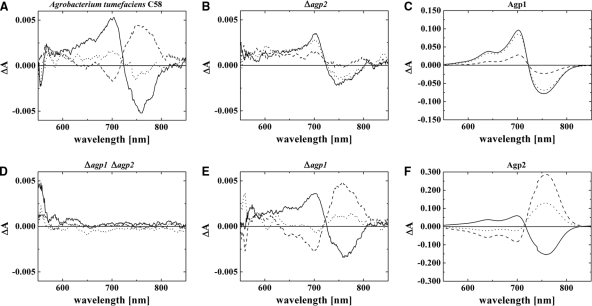
FIG. 4.
Difference spectra of bacterial cell sediments of A. tumefaciens C58 wild type (WT) (A) and agp1 agp2 (D), agp2 (B), agp1 (E) knockout mutants and recombinant proteins Agp1 (C) and Agp2 (F). Photoconversion (solid lines), difference spectra obtained from subtracting absorbance spectra after R from spectra after FR; dark conversion after FR (dotted lines), spectra after 1 h dark of incubation minus spectra after subsequent FR (a positive signal around 700 nm indicates Pfr to Pr dark conversion); dark conversion after R (dashed lines), spectra after 1 h of dark incubation minus spectra after R (a positive signal around 750 nm indicates Pr to Pfr dark conversion). All samples were measured with an Ulbricht sphere; details are given in the Materials and Methods section.

