FIG. 5.
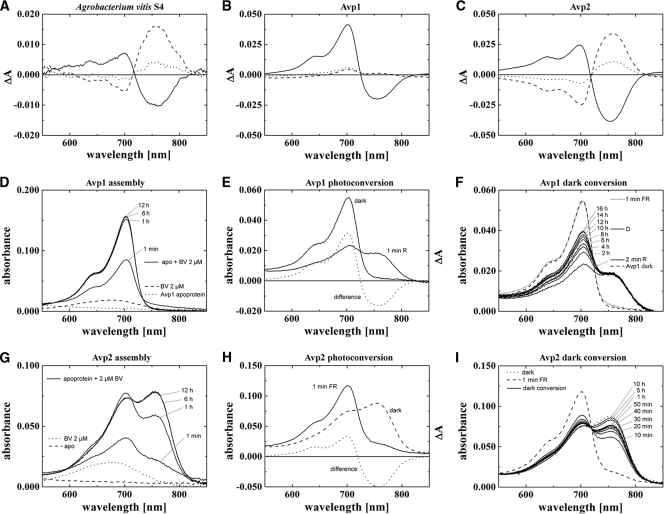
A. vitis S4 phytochrome spectra. (A) In vivo difference spectra of A. vitis bacterial cell sediment. (B and C) Difference spectra of recombinant Avp1 and Avp2, measured with the Ulbricht sphere. (D to F) Absorption and difference spectra of recombinant Avp1 during assembly (D), photoconversion (E), and dark conversion (E) as measured with standard setup (without the Ulbricht sphere). (G to I) Absorption and difference spectra of recombinant Avp2 during assembly (G), photoconversion (H), and dark conversion (I) as measured with a standard setup. For panels A to C solid lines indicate difference spectra obtained from subtracting absorption spectra after R from absorption spectra after FR, dotted lines indicate spectra after 1 h of dark incubation subtracted from spectra after FR (a positive signal around 700 nm indicates Pfr-to-Pr dark conversion), and dashed lines indicate spectra after 1 h of dark incubation subtracted from spectra after R (a positive signal around 750 nm indicates Pr-to-Pfr dark conversion). Symbols in panels D to I are identified on the figure.

