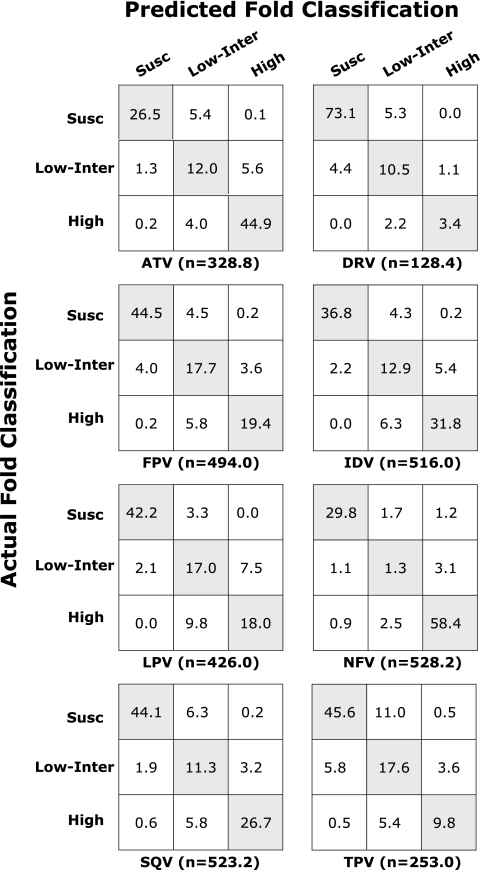
FIG. 1.
Confusion matrices of six PIs containing the number of folds according to the classification of actual fold and the classification of predicted fold. The y axis indicates the susceptible (Susc), intermediate-low (Low-Inter), and high resistance (High) levels of the actual fold. The x axis indicates the susceptible (Susc), intermediate-low (Low-Inter), and high resistance (High) levels of the predicted fold. Each cell contains the average number of folds belonging to corresponding classifications of the actual and predicted fold from 50 test sets (5-fold cross-validation 10 times). The average number of genotype-phenotype correlations in 50 test sets for each drug is indicated (n). The classification accuracy for each test was calculated by the number of correctly predicted fold classification (which is the sum of the diagonal cells) divided by the total number of folds (which is the sum of all the cells). The average classification accuracy over 50 test sets is shown in Table 3. Drug abbreviations: ATV, atazanavir; DRV, darunavir; FPV, fosamprenavir; IDV, indinavir; LPV, lopinavir; NFV, nelfinavir; SQV, saquinavir; TPV, tipranavir.

