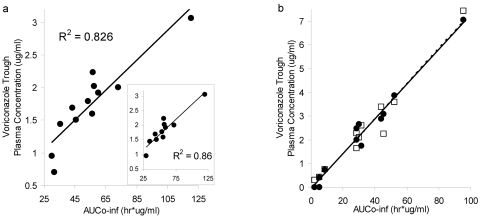
FIG. 2.
Correlation between AUC0-∞ and voriconazole trough plasma concentrations. (a) R2 = 0.83 when AUC0-∞ and trough concentrations (C12) were correlated during an intravenous infusion dosing interval (non-steady state). (Inset) R2 = 0.86 when a potential outlier is omitted. Two patients had very similar C12 and AUC and therefore cannot be visually separated in the figure. (b) R2 = 0.98 (dashed line) and R2 = 0.96 (solid line) when AUC0-∞ was correlated with trough concentrations (C0 [•] and C12 [□], respectively) during an oral dosing interval (steady state; one patient did not complete oral study).

