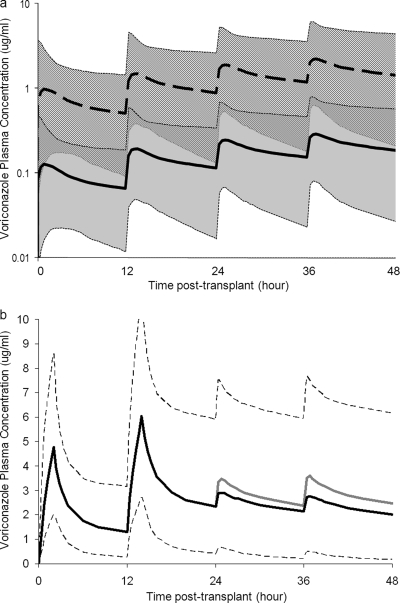
FIG. 5.
Monte Carlo simulation. (a) Simulated voriconazole concentration-versus-time profiles during the first 2 days posttransplant in lung transplant patients with and without cystic fibrosis (CF). The median simulated voriconazole concentration in CF patients (solid line) and non-CF patients (dashed line) with 90% prediction intervals of CF patients (gray shading) and non-CF patients (hatching) is displayed. Extension of the profiles beyond 2 days posttransplant is not shown. (b) Simulated voriconazole concentration-versus-time profiles (extended until steady state was reached) in lung transplant patients receiving two doses of 2-h intravenous infusion (6 mg/kg) followed by oral doses (b.i.d.). The medians of simulated voriconazole concentration with intravenous infusion followed by oral dose of 200 mg (black line) and 400 mg (gray line) are compared. Only the 90% prediction interval for intravenous infusion followed by oral dose of 200 mg (dashed line) is displayed.

