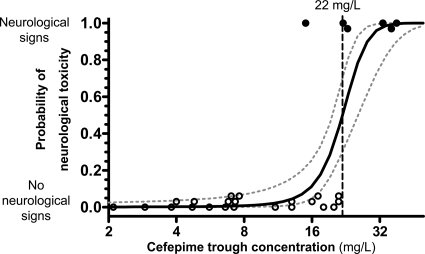
FIG. 2.
Probability of cefepime-associated neurological toxicity as a function of the cefepime trough plasma concentration (logistic regression model). The symbols represent cefepime trough plasma concentrations in each individual patient with neurological toxicity (altered mental status, confusion, or myoclonia) attributed to cefepime according to NCI criteria (black symbols) (top) or without any neurological symptoms and/or signs (white symbols) (bottom). The continuous line represents the logistic regression model predicting the probability of neurological toxicity as a function of the cefepime trough plasma concentration; 1-standard-error confidence bands are reported within dashed lines. The vertical dotted line indicates the trough concentration of cefepime with a 50% increase of the risk of neurological toxicity.

