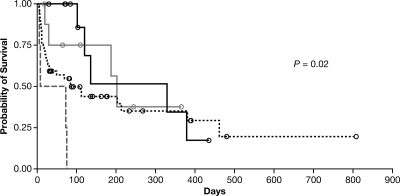
FIG. 2.
Kaplan-Meier curves of patient survival, by site of infection. Differences between groups were significant (P = 0.02). Brain, gray dashed line; disseminated (excluding brain), black dotted line; lung/sinus, solid black line; other, solid gray line; censored patients, black or gray open circles.

