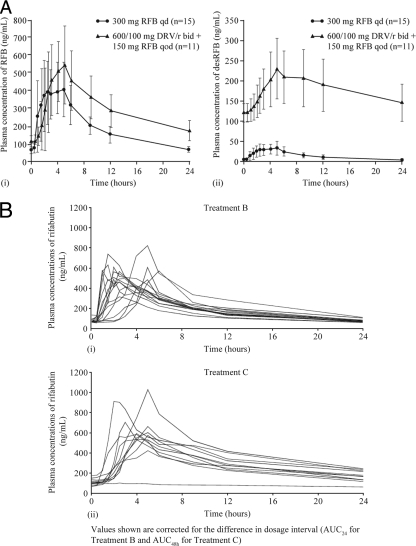
FIG. 3.
(A) Mean plasma concentration-time curves (including SDs) of RFB (i) and desRFB (ii) after administration of RFB alone (treatment B, day 13) and in combination with DRV/r (treatment C; day 13). (B) Individual plasma concentration-time curves of RFB for each volunteer after administration of RFB alone (treatment B; day 13) and in combination with DRV/r (treatment C; day 13).

