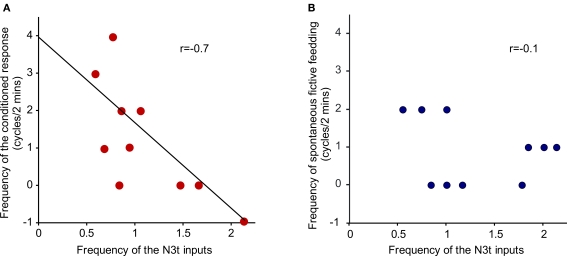
Figure 5.
Inverse correlation between N3t firing rate and frequency of fictive feeding response. (A) The N3t frequency before CS application was compared with the conditioned fictive feeding response measured as a difference score. There is a significant inverse correlation (r = −0.7, P < 0.05, n = 10) at the 4-h time point. (B) The number of background fictive feeding cycles observed in the 2-min preceding the CS test is not correlated with the N3t frequency (r = −0.1, P > 0.05, n = 10).

