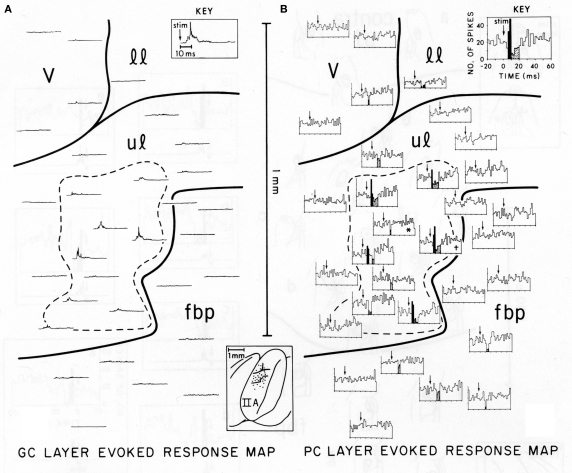
Figure 1.
Comparison of the spatial distribution of granule cell and Purkinje cell layer responses in Crus IIA of the rat, evoked by stimulation of a single upper lip locus. Parallel fibers run from the top of the figure (medial) to the bottom (lateral). (A) Granule cell layer evoked-response map. This map illustrates the spatial distribution of activity evoked by mechanical stimulation of the single ipsilateral upper lip locus. Each rectified, averaged GC layer response (30 trials) is centered over the electrode puncture location from which the response was recorded (see brain diagram of Crus IIA at bottom center). The largest GC layer responses were recorded within the area enclosed by the dashed line. The time scale and stimulus onset (arrow) for all traces are shown in the key at top right. (B) Purkinje cell layer evoked-response map. This map illustrates the spatial distribution of PC layer activity evoked by the same peripheral stimulus that evoked the GC layer response in (A). Each PST histogram represents responses of a different Purkinje cell recorded from the same 19 electrode punctures as the GC layer responses shown in (A). Statistically significant short-latency increases in PC activity are indicated in black with decreases stippled. Both these maps are oriented so that the course of the GC parallel fibers is from the top of the figure to the bottom, i.e., along the axis of the folium (see brain diagram at lower center). In each PST histogram, the arrow indicates the onset of the stimulus. The key at top right indicates the scale for the x and y axes for all histograms. v, vibrissae; 11, lower lip; ul, upper lip; fbp, furry buccal pad.

