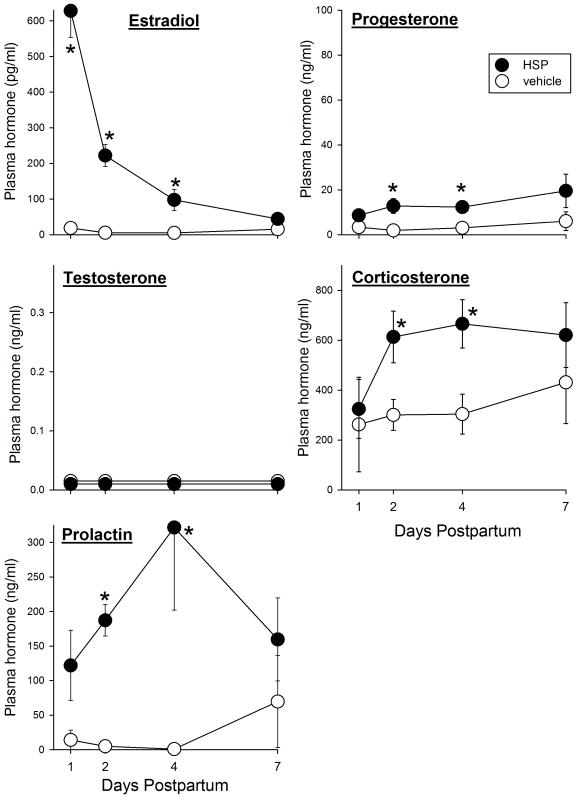
Figure 8.
Plasma hormone levels on “postpartum” days 1, 2, 4 and 7 in ovariectomized rats that had undergone hormone-simulated pregnancy (HSP) or vehicle treatment. Rats that have undergone HSP show significantly elevated immobility in the FST on “postpartum” days 2 and 4 compared to vehicle controls (Stoffel and Craft, 2004; and see Fig. 6). Each point is the mean + or − 1 S.E.M., N=3-6 samples. Note that the y-axis scales are identical in Fig. 7 and 8 except for the estradiol scale, which is compressed in Fig. 8. *significantly greater than vehicle control group, p≤0.05.

