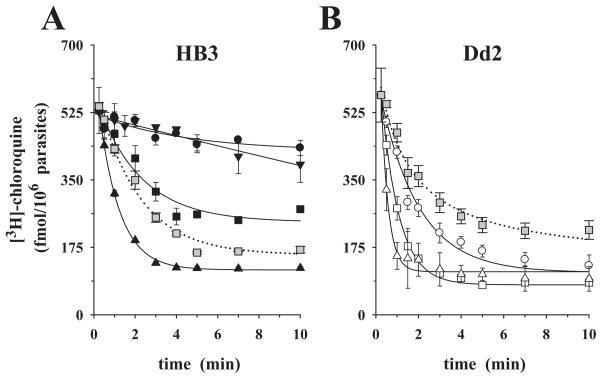
Fig. 3.
Chloroquine efflux kinetics under ‘reverse varying-trans’ conditions, in glucose-rich medium. P. falciparum-infected erythrocytes were pre-loaded with comparable amounts of [3H]-chloroquine, washed and placed in medium containing the following concentrations of cold chloroquine: 0.0 μM (circles), 0.025 μM (inverted triangles), 0.1 μM (squares), 1.0 μM (triangles).
A. CQS parasite HB3.
B. CQR parasite Dd2.
In both panels, the grey squares (0.1 μM external chloroquine) show the effect of addition of 10 μM verapamil at zero time (dotted line). The means ± SEM of at least three independent determinations are shown.

