Fig. 6.
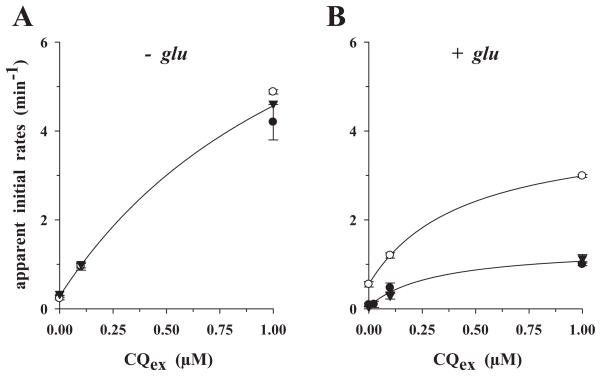
Apparent initial rates of chloroquine efflux as a function of the external cold chloroquine concentration under ‘reverse varying-trans’ conditions. Apparent initial rates were directly computed from the relevant efflux curves of Figs 3–5, as described in Experimental procedures. CQS parasite HB3, closed circles; CQR parasite Dd2, open circles; CQS parasite N3D6, inverted closed triangles.
A. Glucose-deprived cells.
B. Glucose-supplemented cells.
The lines drawn are best-fits to the three-parameter hyperbolic algorithm using the SigmaPlot software.

