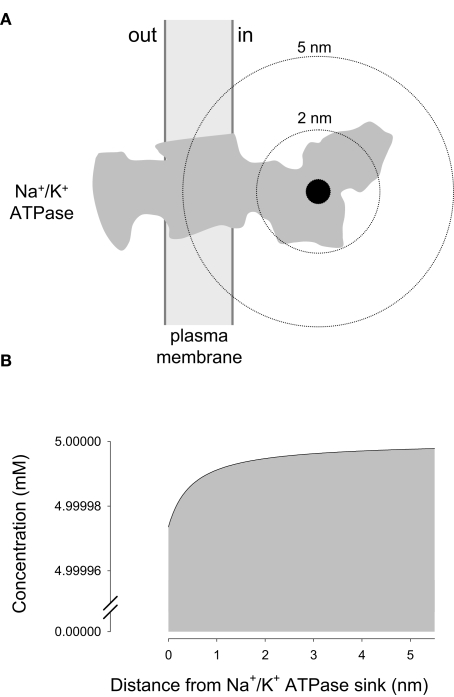
Figure 2.
Negligible local ATP depletion caused by the Na+/K+ ATPase. (A) A sink with a radius of 0.5 nm is shown in black, overimposed on the gray silhouette of the Na+/K+ ATPase, adapted from Morth et al. (2007). (B) ATP concentrations in the immediate vicinity of the Na+/K+ ATPase were calculated using Eq. 8, case II, with the following values: a = 0.5 nm, b = 10 μm, D = 500 μm2/s, u = 5 mM, and q = 48 s−1.

