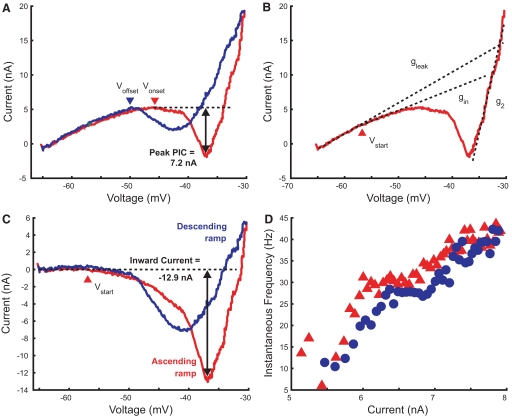
Fig. 1.
Measurements made from current–voltage (I–V) plots obtained during somatic voltage clamp. The red lines show the I–V relation obtained during the ascending limb of the voltage ramp; the blue lines show the relation during the return to resting potential. The horizontal dashed line in A shows the current at the start of the negative-slope region (NSR), marked by the arrowhead (Vonset); net inward current relative to this current was measured as peak persistent inward current (PIC), as indicated. Termination of the PIC on the descending voltage ramp is indicated by Voffset at the second arrowhead. Dashed diagonal lines in B mark regression lines used to determine the following slope conductances: leak conductance (gleak); the initial inward conductance (gin); and the outward conductance at depolarized potentials (g2). C shows the I–V relation after subtraction of the leak current (i.e., the gleak regression line). The arrowhead indicates the potential at which PIC is first activated (Vstart), corresponding to the inward deviation from the leak current. Net inward current relative to the leak current was measured as the negative peak in the I–V relation as shown. The frequency–current (f–I) plot obtained for this motoneuron (tibial, GN = 0.38 μS) is shown in D.

