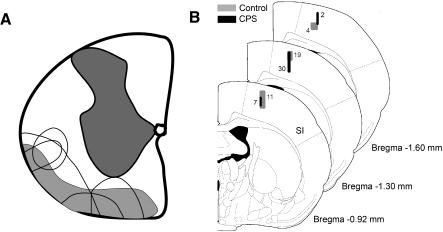
Fig. 1.
A: drawing of coronal section through the cervical spinal cord, showing the location and size of lesions in animals with mechanical hyperalgesia (unfilled areas). Shaded areas represent the location of ascending spinothalamic tract axons, adapted from Fig. 5 in Giesler et al. (1981). B: coronal sections of the rat brain (Paxinos and Watson 1998) showing locations of all recorded neurons in this study. Numbers represent the number of neurons recorded in each shaded area of primary somatosensory (SI) cortex.

