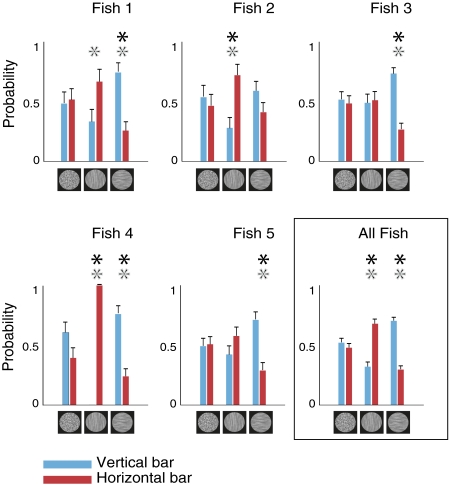
Fig. 3.
Responses of archer fish to the critical and control conditions (test and prior trials). Shown here are results of individual fish and the pooled results for all five fish. Blue bars depict the probability of the fish to hit a vertical target, whereas red bars depict the probability to hit a horizontal target, both broken down by background texture type. Error bars represent SEM. Note the tendency of all fish to prefer the target whose orientation is incongruent with the orientation of the background. Gray asterisks denote the conditions for which a significant effect is observed (P < 0.05) when assuming an equal a priori probability of the fish to hit the vertical or horizontal bar (i.e., assuming q = 0.5). The effect is highly significant (P < 10−12) for the pooled results. The results for isotropic background represent an internal bias of the fish toward certain target orientation. Black asterisks denote the conditions for which a significant effect is observed (P < 0.05) even after this bias is discounted. When results from all fish are pooled together the effect is again highly significant (P < 10−4) for both background orientations.

