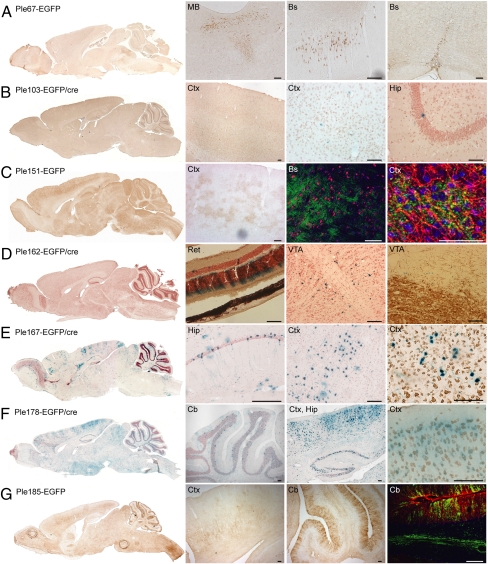
Fig. 4.
Novel MiniP expression patterns in the adult brain and retina. EGFP is detected using anti-GFP immunochemistry (brown) or EGFP/cre, detected using X-gal histochemistry (counterstained with neutral red). All sections are sagittal unless otherwise stated. Hip, hippocampus; MB, mid brain; Ret, retina; VTA, ventral tegmental area. (A) Ple67-EGFP (FEV RRs) expression is enriched in all raphe nuclei: from left to right, dorsal (coronal section), magnus (sagittal section), pallidus/obscurus (coronal section). (B) Ple103-EGFP/cre (HAP1 RRs) shows sporadic staining in various regions of the brain. (C) Ple151-EGFP (OLIG1 RRs) expresses throughout the brain in a puffy-like manner. The second detail image shows no costaining of EGFP (green) with neuronal marker NeuN (red). The last image shows costaining of EGFP (green) with the myelinating oligodendrocyte marker RIP (red). (D) Ple162-EGFP/cre (PITX3 RRs) is very specifically expressed in cells just dorsal to the VTA as well as the retina. The last image shows no costaining of X-gal (blue) with tyrosine hydroxylase (brown). (E) Ple167-EGFP/cre (POGZ RRs) is expressed in patches of cells across the brain. The last image shows costaining of X-gal (blue) with NeuN (brown). (F) Ple178-EGFP/cre (RGS16 RRs) is expressed in various regions of the brain. The last image shows a costaining of X-gal (blue) with NeuN (brown). (G) Ple185-EGFP (S100B RRs) expresses in Bergmann glia of the cerebellum and myelinated fibers in the cortex. The last image is a costaining of EGFP (green) with the endogenous S100B protein (red). (Scale bars, 100 μm, except C rightmost image, 50 μm.)

