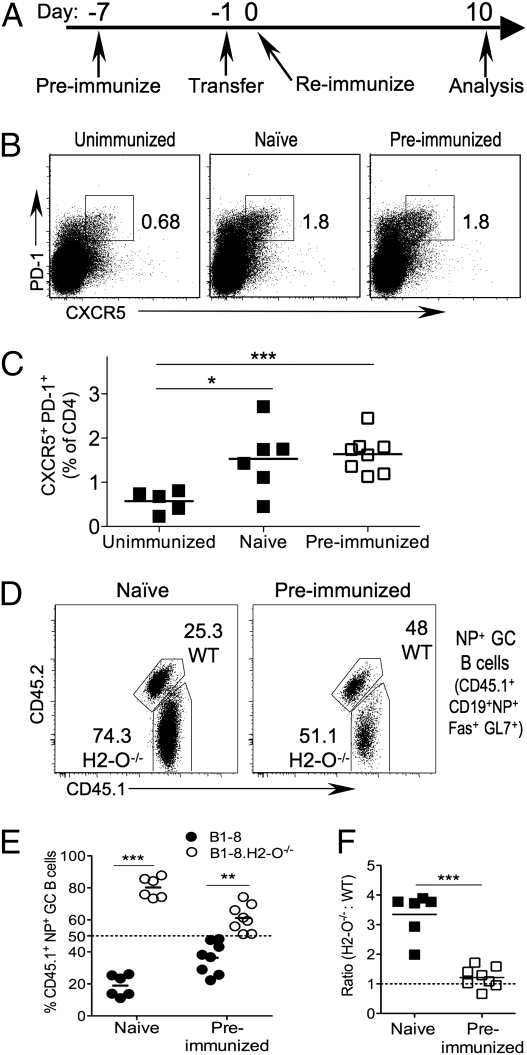
Fig. 3.
B1-8 and B1-8.H2-O−/− B cells populate the GC equally in the presence of abundant T-cell help. (A) Schematic representation of experiment setup. Marked B1-8 and B1-8.H2-O−/− cells were mixed at a 1:1 ratio and transferred into either naïve hosts or hosts that had been immunized 7 d prior with NP-CGG. The next day, mice were immunized with NP-CGG in alum for the first time (naïve) or second time (preimmunized), or were left unimmunized. (B) Size of TFH population was examined on day 10 postimmunization. Plots shown are gated on CD4+ T cells. Numbers indicate size of gated population as percentage of CD4+ cells. (C) Quantification of data shown in B for multiple mice. (D) Contribution of WT and H2-O−/− B1-8 cells to NP+ GC B-cell pool upon preimmunization. (E and F) Quantification of population defined in D as percentage of donor-derived NP+ GC B cells (E), and as a ratio of H2-O−/− to WT populations, normalized to the ratio in the transferred mixture (F). Statistical significance was calculated using two-tailed paired t test in E and a two-tailed unpaired t test in C and F.

