Fig. 3.
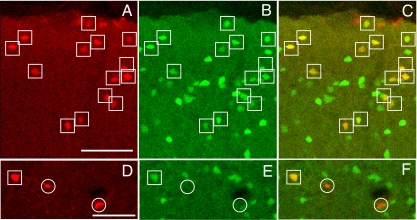
Cortical neurons expressing mCherry after infection with EnvB-pseudotyped rabies virus and TVB–NRG1 bridge protein in a mouse line that expresses GFP in cortical inhibitory neurons. (A) Low power view illustrating overall location and morphologies of infected mCherry-labeled neurons. Pial surface is at the top. (B) Same section as A, illustrating GFP expressing inhibitory neurons in the GAD-67 GFP knock-in mouse line. (C) Overlay of A and B showing that there are many double-labeled (yellow/orange) cells. Double-labeled cells are marked by boxes, whereas cells expressing mCherry but not GFP are marked by circles (D–F). (D–F) Higher powered view of single- (circled cells) and double-labeled cells (boxed) in the cortical plate (outside layer 1). (Scale bars: A, 75 μm and corresponds to A–C; D, 75 μm and corresponds to D–F.)

