Fig. 1.
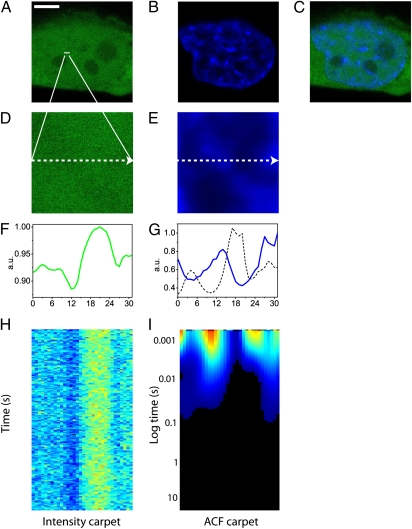
ACF carpet analysis. (A) Free EGFP in a CHOK1 cell. (Scale bar: 5 μm.) (B) Nucleus of a CHOK1 cell stained with Hoechst 33342. (C) Merge of the images shown in A and B. (D) Free EGFP in the plane of the line drawn in the nucleus: 3.3 μm. (E) Hoechst 33342 staining in the plane of the line drawn in the nucleus: 3.3 μm. (F) Intensity profile of free EGFP across the line drawn. (G) Intensity profile of Hoechst 33342 staining across the line drawn (blue line) and an overlay of 1/G(0) (dashed black line), which is equivalent to the intensity profile of free EGFP in F. (H) Fluorescence intensity carpet of the line drawn across freely diffusing EGFP (200,000 lines). (I) ACF carpet of the line drawn across freely diffusing EGFP (90,000 lines analyzed).

