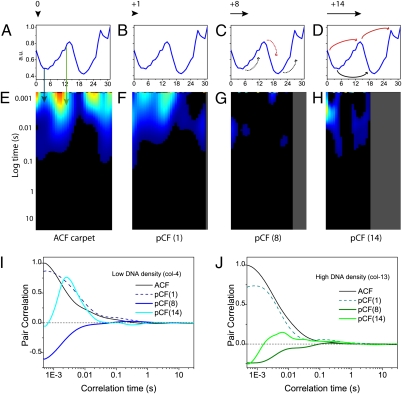
Fig. 2.
pCF carpet analysis of intranuclear diffusion. (A–D) Intensity profile of the Hoechst 33342 stain across the line measured. The black arrow above each profile indicates to scale the distance that columns were cross-correlated in the pCF carpets directly below. The black and red curved arrows indicate respectively the DNA environment that is being cross-correlated from low or high DNA in the pCF carpets directly below. (E) pCF(0) carpet, which corresponds to calculation of an ACF carpet (90,000 lines analyzed). (F) pCF(1) carpet, which corresponds to cross-correlation of adjacent pixels in the same DNA environment within the PSF. (G) pCF(8) carpet which corresponds to cross-correlation of pixels in different density DNA environments. (H) pCF(14) carpet, which corresponds to cross-correlation of pixels in low-low DNA around a high DNA density environment or pixels in high-high DNA around a low DNA density environment. All carpets are depicted on the same color scale: the minimum value was set to 0, and this corresponds to black (no communication). (I) Plot of the amount of correlation for column 4 (low DNA) at each analyzed distance (0, 1, 8, and 14). Curves are normalized to 1 with respect to the ACF. (J) Plot of the amount of correlation for column 13 (high DNA) at each analyzed distance (0, 1, 8, and 14). Curves are normalized to 1 with respect to the ACF.

