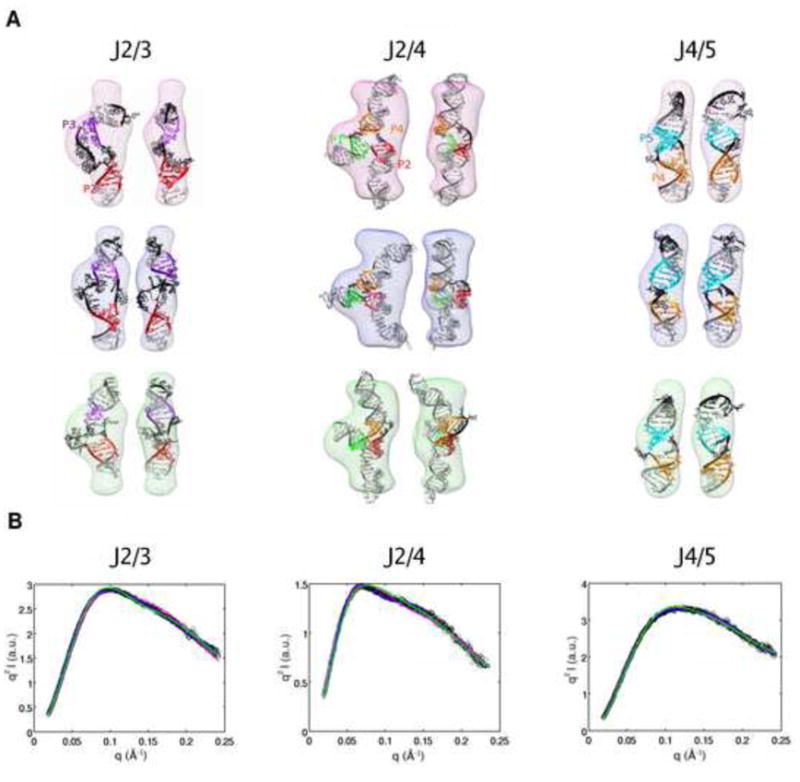
Figure 3.

Fitting of the three highest-ranking models of the isolated junctions of the TPP riboswitch to experimental data: J2/3 (left column), J2/4 (middle column), J4/5 (right row). Models for each of the junctions were generated using MC-SYM. (A) The three highest-ranking models for the junctions overlaid on the bead models calculated for the experimental profiles shown in (B). The coloring of the helices is identical to Figure 1. The bead models are colored differently to indicate models ranked 1 to 3: rank 1 (pink), rank 2 (blue), rank 3 (green). Two views of each model are shown side by side, with a rotation of 90° about the z-axis, in the same colored bead models. (B) Experimental SAXS profiles of the isolated junctions in Kratky representation overlaid on the predicted SAXS profiles from the three highest-ranking models of the junctions, as determined from a least-squares fitting routine (Methods). The black circles represent the experimental data, and the solid lines show the predicted profiles from the models. The solid lines are colored the same as the bead model to identify the model that gives that profile.
