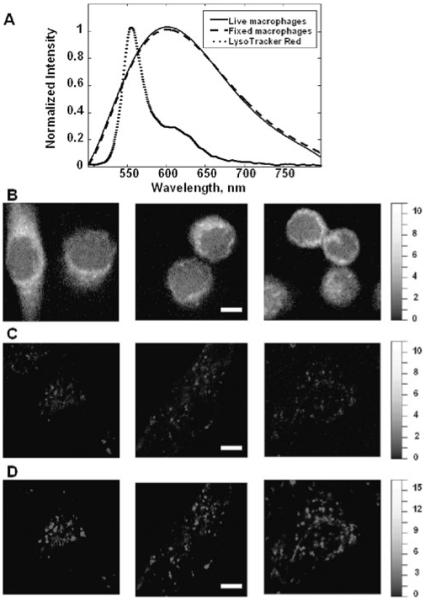
Figure 3.

Comparison of autofluorescence properties in living and fixed macrophage cells. A: Spectral signatures recovered from MCR analysis of hyperspectral imaging data. B: MCR extracted concentration map of macrophage autofluorescence in fixed cells. C: MCR extracted concentration map of macrophage autofluorescence in a separate set of living cells. D: MCR extracted concentration map of LysoTracker Red fluorescence from the same cells shown in C. The spectra in A were derived from images in B, C, and D. Scale bar = 5 μm. Intensity scales have been adjusted for display purposes. 61 × 84 mm (300 × 300 dpi).
