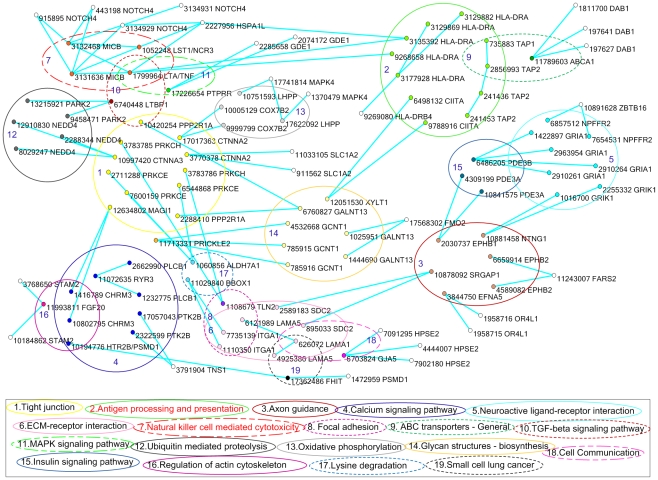
Figure 6. Interacting SNPs that were located in 19 pathways formed a network.
Each pathway was represented by an ellipse with the number. The SNPs were represented by nodes and placed insight their located pathways. Nearby each SNP there was its RS number and the name of its located gene. The pathway and its harbored SNPs were labeled by the same color. The interacting SNPs were connected by the solid light green lines.

