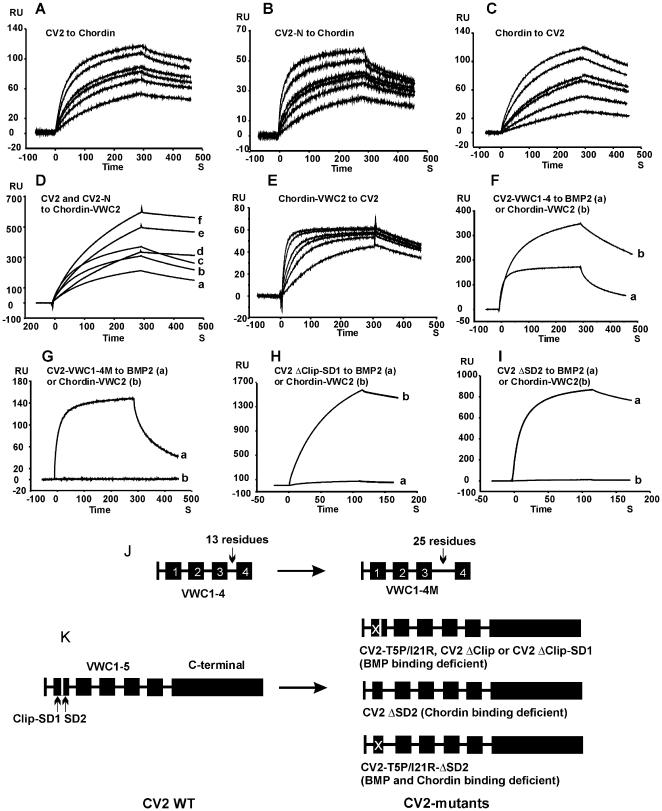
Figure 1. BIAcore analysis of CV2/Chordin interaction.
Sensograms showing the binding of 100,200,300,400,800 and 1200 nM CV2 (A) or CV2-N (B) to immobilized Chordin; 50, 100, 150, 200, 400 and 600 nM Chordin to immobilized CV2 (C); 100, 200 and 300 nM CV2-N (D, a,b,c) or CV2 (D,d,e,f) to immobilized VWC2 of Chordin; 10, 20, 30, 40, 80, 120 nM VWC2 of Chordin to immobilized CV2-N (E); 200 nM CV2-VWC1-4 (F) or CV2-VWC1-4M (G) to immobilized BMP2 (Fa, G,a) or VWC2 of Chordin (Fb, G,b); 300 nM CV2 ΔClip-SD1(H) or CV2 ΔSD2 (I) to BMP2 (Ha, Ia) or VWC2 of Chordin (Hb, Ib). (J) and (K) show schemes of the CV2 mutant constructs. Abbreviation: RU, resonance unit.

