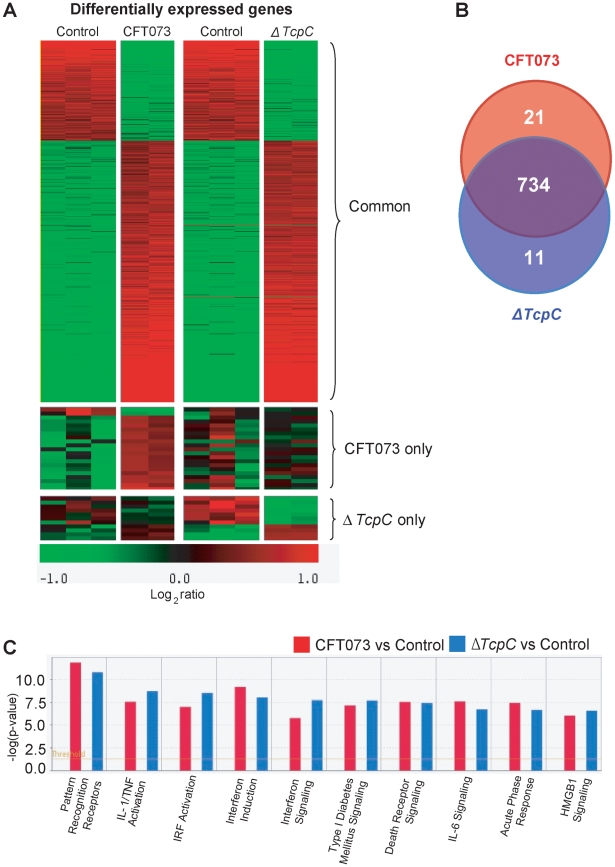
Figure 4. Uroepithelial gene expression in response to in vitro infection with CFT073 or ΔTcpC.
(A) A two-dimensional hierarchical heat map illustrating differentially transcribed genes in human A498 cells infected with CFT073 or ΔTcpC versus the control group. Analysis was performed on 766 genes with a fold change of at least two over untreated cells, and classified based on whether they are CFT073 or ΔTcpC specific, or common to both infections. Induced genes are represented by brighter shades of red, while down regulated genes are represented by brighter shades of green (see color scale). (B) Venn diagram showing numerical distribution of differentially expressed genes in CFT073 (red) and ΔTcpC infected (blue) cells compared to mock infected cells. (C) A comparison of the 10 highest scoring biological pathways between infected cells and controls as analyzed by Ingenuity Pathway Analysis with default settings.

