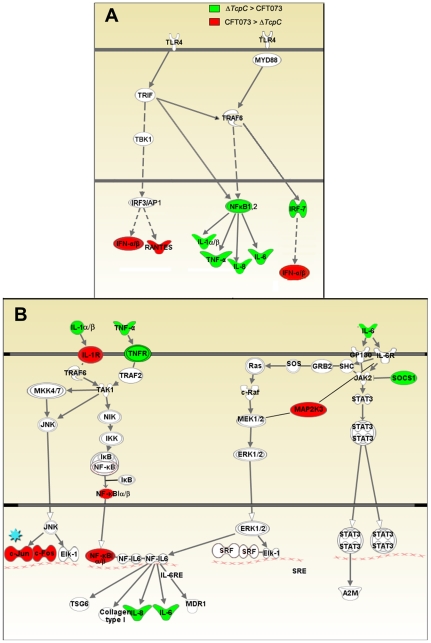
Figure 5. Identification of pathway-specific genes by Ingenuity Pathway Analysis in response to in vitro infection.
(A-I) Pattern recognition pathway. (A-II) IL-6/IL-1 pathway. Each node represents a protein whose functional class is represented by various shapes (ovals = transcription factors, spiral = kinases, dumbbell = transcription regulators, V shape = cytokine or growth factors, Y shape = transmembrane receptors, circles = others). Direct protein interactions are represented by solid lines, while dashed lines indicate indirect interaction. A red node indicates up regulation of a protein in response to CFT073, while a green node indicates down regulation by CFT073 relative to ΔTcpC.

