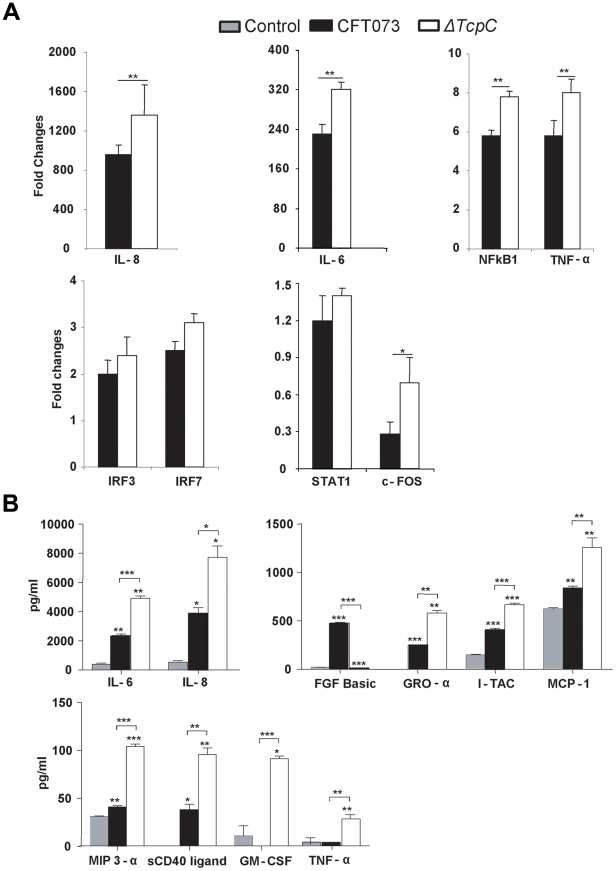
Figure 6. Protein array analysis in response to in vitro infection with CFT073 or ΔTcpC.
(A) RT-PCR analysis of human kidney cell lines infected with CFT073 or ΔTcpC for 4 hrs. All values represent means ± SEMs of three experiments. (B) Uroepithelial cytokine responses to infection with CFT073, ΔTcpC or mock-infected controls. A498 cells were stimulated for 4 hours with the indicated bacterial strains. Supernatant cytokine levels are in pg/ml and represent means ± SEMs of three experiments. Significant differences are indicated by single * (p<0.05), double ** (p<0.01) or triple asterisks *** (p<0.001, Student's t-test).

