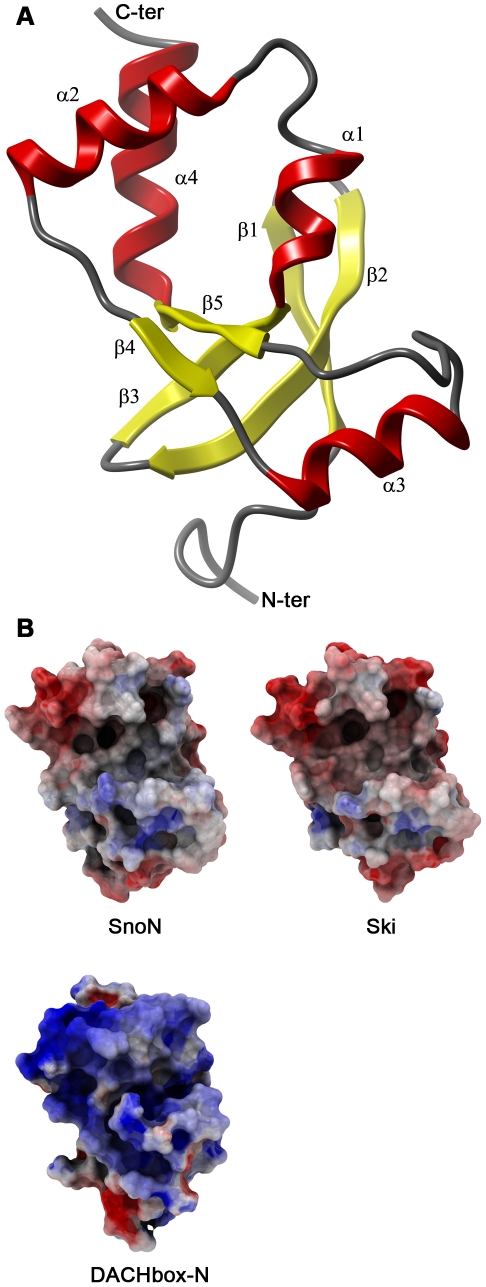
Figure 2. The SnoN-DHD structure and surface charge comparison.
Panel A: Ribbon representation of SnoN-DHD. Panel B: Comparison between electrostatic surfaces of SnoN-DHD (chain A), Ski-DHD and DACHbox-N. Molecular surfaces are colored according to electrostatic potentials with maximum color potential set to ±5 kT/e. SnoN-DHD, Ski-DHD (PDB 1SBX) and DACHbox-N (PDB 1L8R) are in the same orientation as in Figure 2A. Electrostatic potential was calculated with the program ICM-Pro v.3.7-1e [29] using the REBEL (rapid-exact-boundary-element) method.

