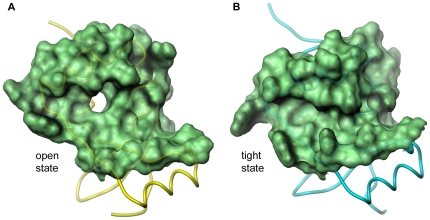
Figure 5. Open and tight conformation of SnoN-DHD: molecular surface representation.
Panel A: SnoN chain C. Backbone of SnoN-DHD chain C is colored in yellow. Molecular surface of residues form the conserved groove and involved in conformational change is displayed in green. Panel B: SnoN chain F. Same as Panel A except that blue was used as a color for the backbone of chain F.

