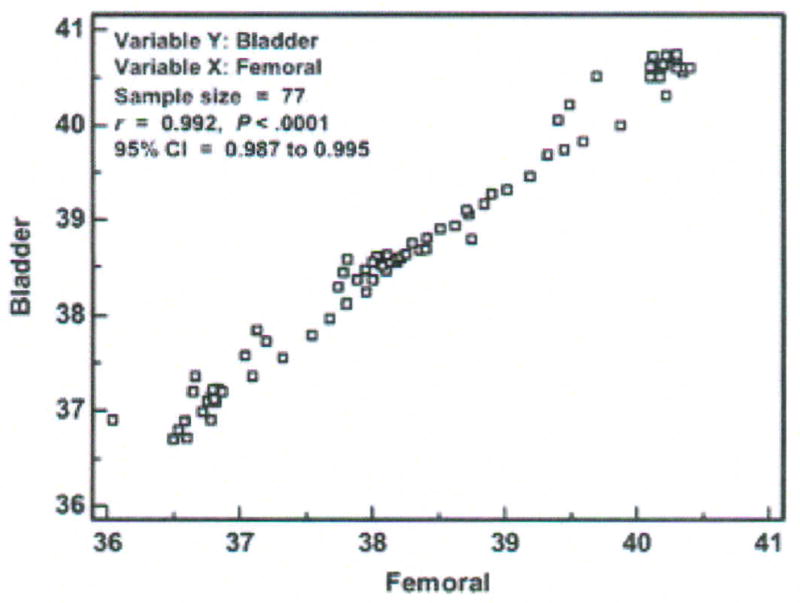
Figure 2.

Scatter diagram, correlation coefficient (r), and 95 % confidence interval (CI) of temperatures (degrees Centigrade) measured with the bladder and femoral methods in one critically ill porcine subject (P003). Data points represent averages of 30-minute aggregates.
