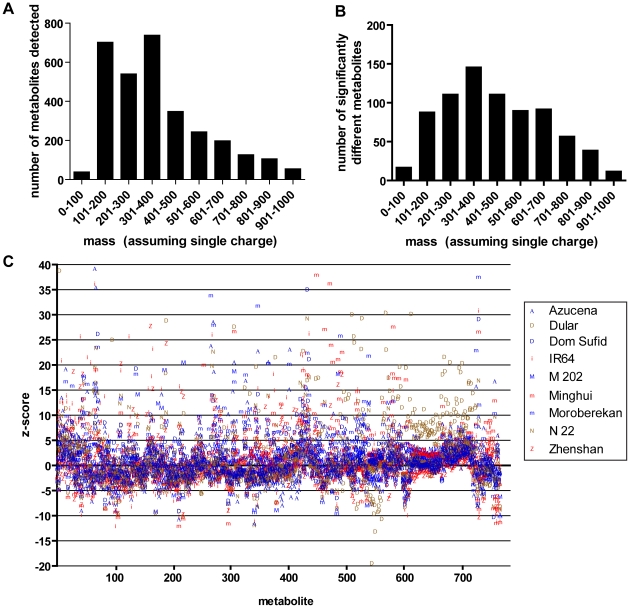
Figure 1. Metabolite detection across ten rice varieties.
(A) Rice metabolites were detected by UPLC-MS and all 3,097 metabolites were sorted by size. (B) The 763 metabolites that differ among the ten varieties were dispersed across a similar mass distribution as the total metabolite profile. (C) Z-score analysis on the 763 metabolites was conducted using Nipponbare (japonica) as a reference. Indica, japonica, and aus varieties are shown in red, blue, and brown, respectively. A total of 32 data points with a z-score of greater than 40 were outside of the area shown.

