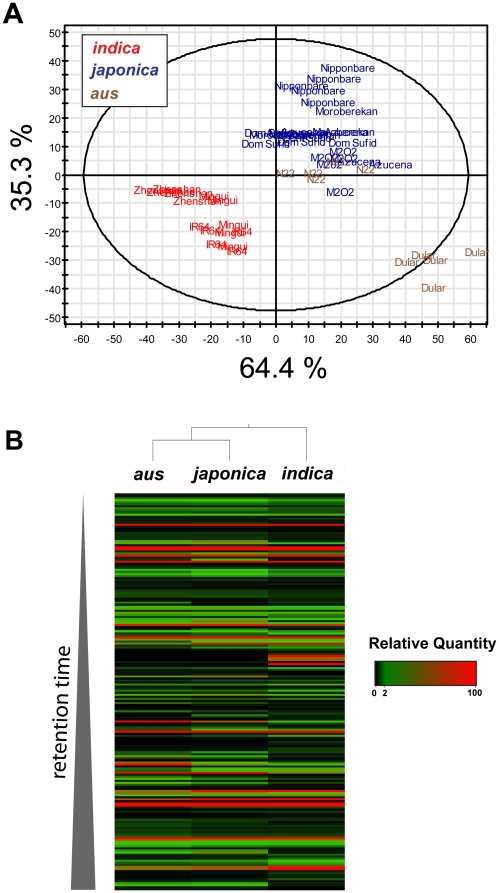
Figure 2. Subspecies analysis of the cooked rice metabolome.
(A) PLS-discriminant analysis was conducted on ten rice varieties and was colored according to subspecies as indica (red), japonica (blue), and aus (brown). (B) The 194 metabolites that differ among the three subspecies were shown in a heat map whereby each cell represents a single metabolite. Metabolites were arranged according to retention time (0.5–12 minutes), and colors indicate relative quantities. Hierarchical clustering was performed using Euclidean distances.

