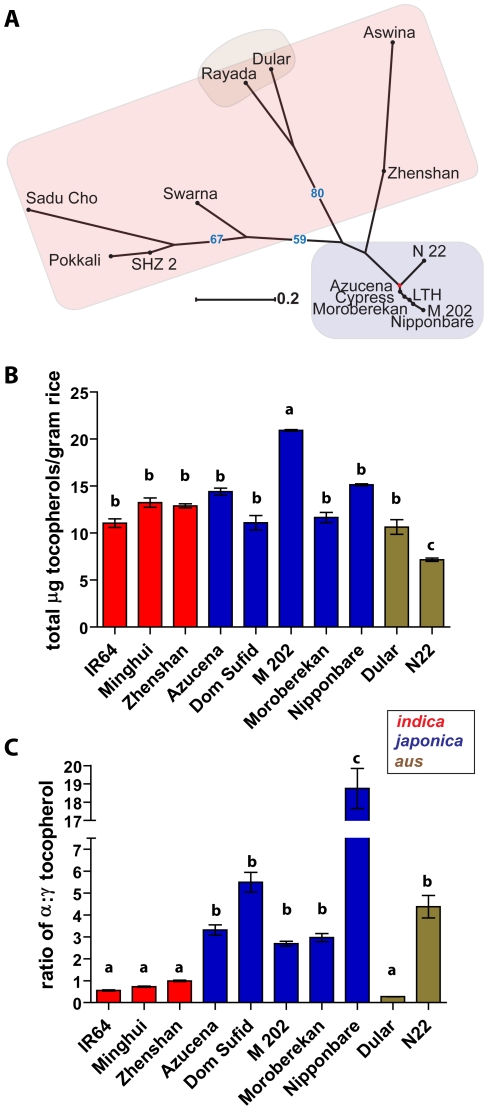
Figure 5. Variation in vitamin E concentrations in cooked rice.
(A) An unrooted, neighbor-joining tree was developed based on total SNPs identified in the vitamin E synthesis pathway. Clouds were colored according to subspecies: indica (red), japonica (blue), and aus (brown). (B) The total quantities of tocopherols (α,γ, and δ) per gram of rice were determined. (C) Ratios of α:γ tocopherol were calculated for each variety. Values are expressed as the mean ± the standard error of the mean, and statistical groupings denoted by the letters a, b, and c (ANOVA, Tukey post-hoc, P<0.05).

