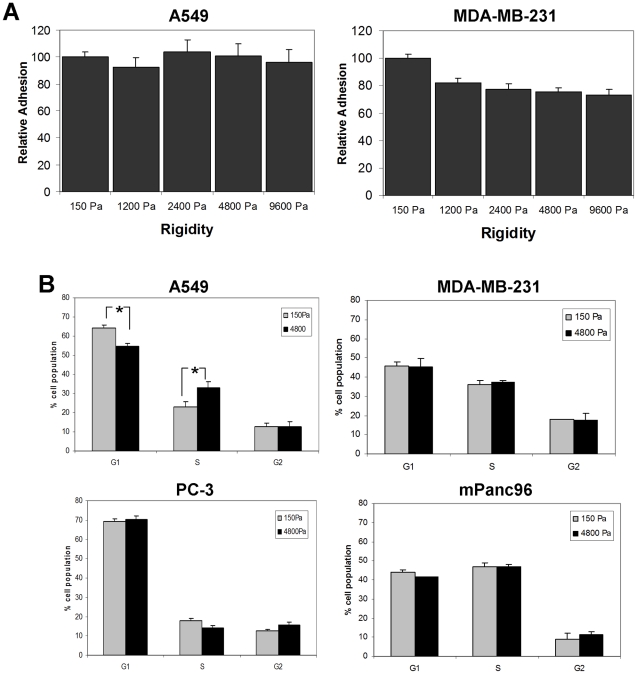
Figure 4. Analysis of adhesion and cell cycle of cancer cell lines on soft gels.
A.) A549 and MDA-MB-231 cells were plated on a soft-plate96 and total cell numbers per well were counted after 6 hours of attachment. Data are expressed as percent of adhesion to the 150 Pa gels. B.) A549 and PC-3 cells were cultured on 150 Pa or 4800 Pa gel substrates for 5 days followed by cell cycle analysis. Results show average of at least three experiments ± SEM. * p<0.05.

