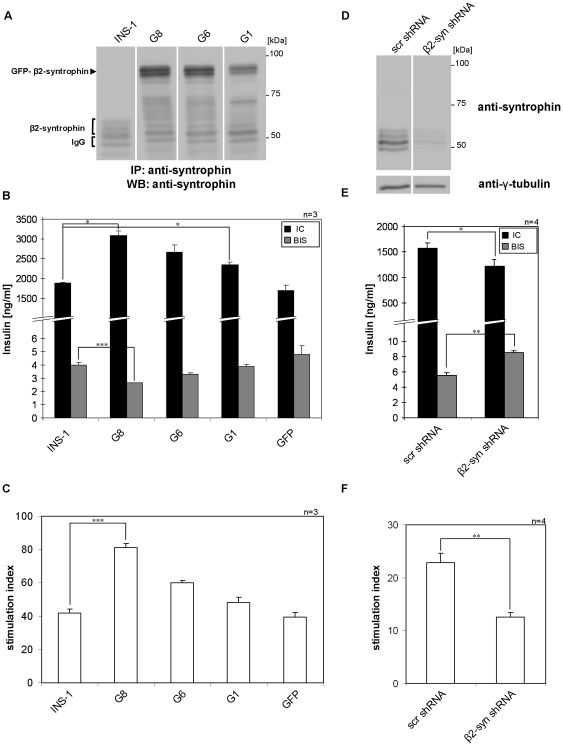
Figure 2. Insulin content and secretion of INS-1 cells in relation to β2-syntrophin expression levels.
A) Immunoblots with the anti-syntrophin antibody on immunoprecipitates obtained with the same antibody from extracts of INS-1 cells and three INS-1 cell clones (G1, G6 and G8) stably transfected with GFP-β2-syntrophin. B) Insulin content (IC) and basal insulin secretion (BIS) of INS-1 cells, GFP-β2-syntrophin INS-1 cell clones G1, G6, G8 and INS-1 cells stably transfected with GFP. C) Insulin secretion Stimulation Index (SI) of INS-1 cells, GFP-β2-syntrophin INS-1 cell clones G1, G6, G8 and GFP INS-1 cells. D) Immunoblots with anti-syntrophin and anti-γ-tubulin antibodies on extracts of INS-1 cells transfected with a scrambled shRNA (scr shRNA) or an shRNA for the knockdown of β2-syntrophin (β2-syn shRNA). E) IC and BIS of INS-1 cells transfected with β2-syn or scr shRNAs. F) SI of INS-1 cells transfected with β2-syn or scr shRNAs. n = number of independent experiments; *, p = 0.05; **, p = 0.01; ***, p = 0.005. p-values in B and C are relative to INS-1 cells, while in E and F they are relative to INS-1 cells transfected with scr shRNA.

