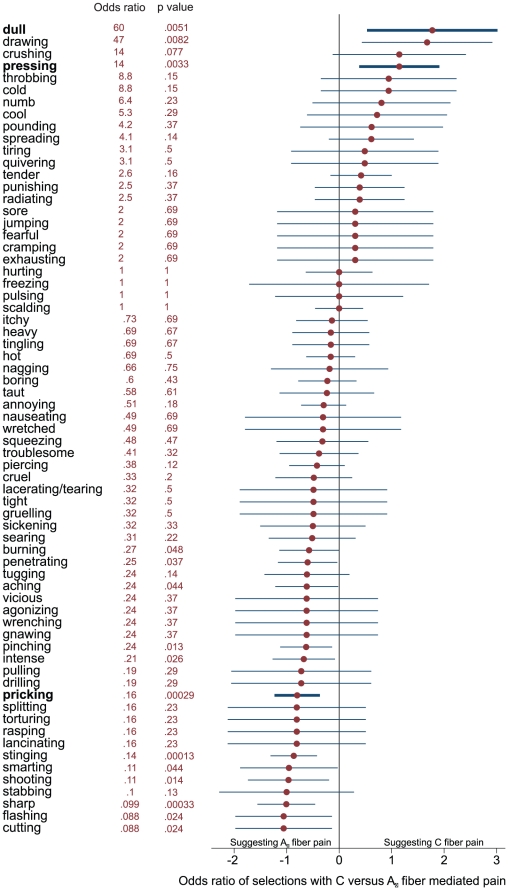
Figure 3. Odds ratios.
Odds ratios, calculated as (A · D)/(B · C), where A is the number of selections of the descriptor for C fiber pain, B the total number of presentations of C- fiber pain minus A, C the number of selection of the descriptor for Aδ fiber pain, and D the total number of presentations of Aδ pain minus C, and 95% confidence intervals, calculated as odds ratio±1.96 · (1/A+1/B+1/C+1/D)0.5, of the selections of the descriptors for C fiber mediated pain (pooled ratings of blunt mechanical pressure and 5-Hz electrical stimuli) and the number of selections of the descriptors for Aδ mediated pain (pooled ratings of punctate mechanical pressure and laser heat), sorted from top to bottom for decreasing selectivity for C fibers and increasing selectivity for Aδ fibers. The descriptors used in the questionnaire test (Figure 2) are marked in bold letters and thicker lines. Odds ratios and the corresponding p-values resulting from χ2 statistics are indicated at the right of the descriptors. Please note that the 10 descriptors that were never used are excluded and therefore, the total number of displayed descriptors is 67.

