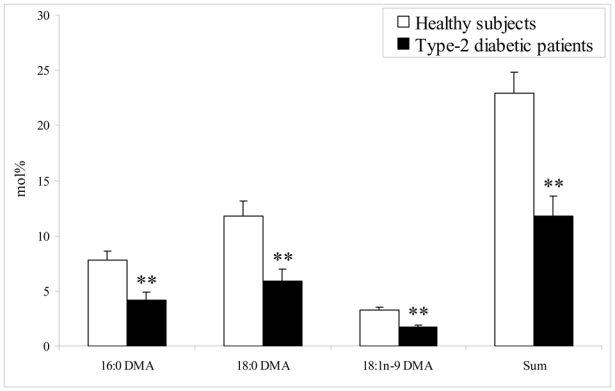
Figure 1.

Plasmalogen alkenyl-chain composition of LDL ethanolamine phospholipids from healthy subjects and type-2 diabetic patients. Values, expressed as mole percent of main fatty acids, are means ± S.E.M. of at least seven subjects per group. **: p ≤ 0.01 compared with LDL from healthy subjects. DMA, dimethylacetal.
