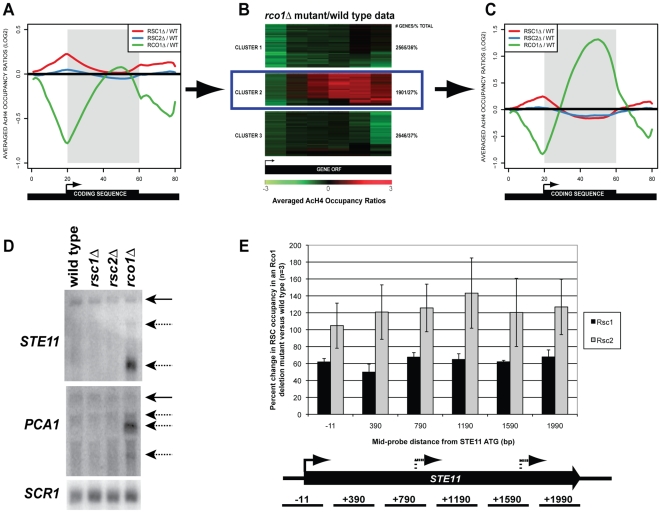
Figure 3. Genome-wide occupancy of acetylated H4 in rco1Δ, rsc1Δ, and rsc2Δ mutant strains.
Indicated mutants were subjected to ChIP with an antibody directed against acetylated H4 followed by microarray analysis (n = 3) using the Agilent yeast 4x44K platform (Agilent Technologies, Santa Clara, CA). (A) Average gene analysis of log2 ratio for the enrichment of AcH4 in mutant versus the wild type strain (Y-axis). X-axis indicates the number of bins used for average gene analysis. The shaded grey area represents any given gene ORF. (B) ORFs from the dataset comparing enrichment of AcH4 in rco1Δ mutants versus wild type were divided into 6 bins [51], followed by K-means clustering using MeV [57]. The ORFs represented by Cluster 2 show an increase in AcH4 across the ORF in rco1Δ mutants. The scale at the bottom of the figure represents the log2 ratio for the enrichment of AcH4 in rco1Δ mutant versus the wild type ranging from −3 to 3. (C) Average gene analysis of log2 ratio for the enrichment of AcH4 in mutant versus the wild type strain for gene cluster 2 (genes with enrichment of AcH4 in the ORF). (D) Northern blot of RNA extracted from wild type (BY4741) or indicated mutant strains was probed for the 3′ regions of STE11, PCA1 or for SCR1 (loading control). Solid arrows denote full-length transcript, while dashed arrows indicate cryptic transcripts. Blot shown is representative of three biological repeats. (E) ChIP followed by qPCR using primers corresponding to the STE11 ORF was performed with antibodies against c-myc-tagged Rsc1 or Rsc2. The X-axis indicates the mid-position of each probe set used in the PCR (base pairs). The Y-axis represents percent change of c-myc IP/input for rco1Δ mutants compared to IP/input for the wild type strain. Error bars represent standard deviation of three biological repeats.

