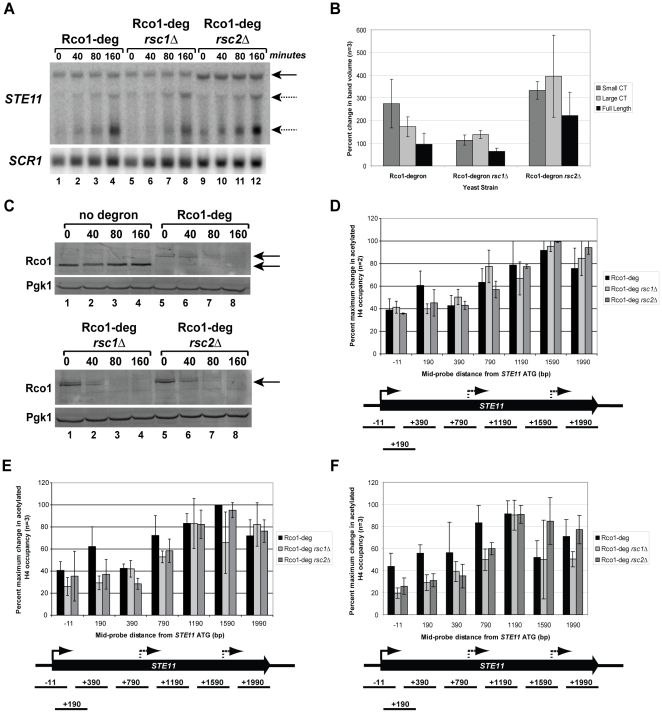
Figure 4. Deletion of RSC1 in an Rco1-degron background results in a partial suppression of the small STE11 cryptic transcript.
(A) Northern blot of RNA extracted from indicated degron strains at 0, 40, 80, and 160 minutes post-degron induction. Blots were probed with amplicons from the 3′ region of STE11 or from SCR1 (loading control). Cryptic transcripts are indicated with dashed arrow and full-length transcripts by solid arrow. Blots are representative of 3 biological repeats. (B) Densitometry analysis of bands from northern blots in (A). Data is shown as percent change in band volume at the 160 minute time point compared to time zero (Y-axis) for each transcript in each strain (X-axis). Image Quant (GE Biosciences) was used to quantitate band density on the northern blot. All STE11 transcripts were normalized to the loading control, SCR1. Error bars represent the average deviation of three biological repeats. (C) Western blot of protein extracted from degron strains at indicated time post degron induction. Tagged Rco1 protein was detected with anti-FLAG antibody. The same blots were also probed with anti-Pgk1 as a loading control. Blots are representative of 3 biological repeats. (D–F) ChIP followed by qPCR using primers corresponding to the STE11 ORF was performed with antibodies against acetylated H4. The X-axis indicates the mid-position of each probe set used in the PCR (base pairs). The Y-axis represents percent maximum change of the ChIP product at 40 minutes (D), 80 minutes (E), or 160 minutes (F) versus 0 minutes post degron induction for each strain. Error bars represent standard deviation of three biological repeats, except (D), which is two biological repeats.

