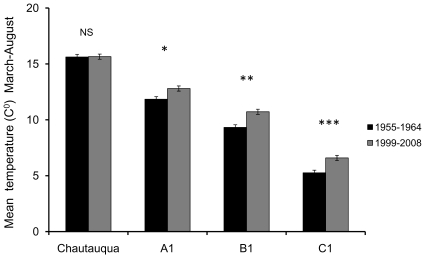
Figure 1. Seasonal warming at the four survey sites.
Ten-year mean temperatures from March through August across the survey sites for the years during Alexander's original survey (1955–1964) and the years including and prior to the resurvey (1999–2008). NS = Not Significant, * P = 0.01, ** P = 0.001, *** P = 0.0002.

