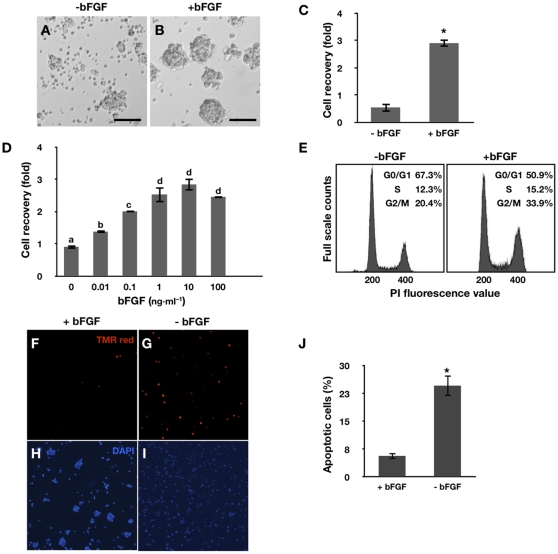
Figure 2. Effects of bFGF on PGC proliferation.
(A–B) Morphology of PGCs in the presence of bFGF and 4 days after bFGF withdrawal (Bar = 100 µm). (C) Effect of bFGF on cell recovery after 4 days of culture (mean ± SEM; n = 4) (*significant differences following treatment; p<0.01). (D) Dose-dependent effect of bFGF on the proliferation of PGCs (mean ± SEM; n = 3) (superscripts indicate significant differences between treatments; p<0.05). (E) Analysis of cell cycle distribution of PGCs in the presence of bFGF (left) and 24 h after bFGF withdrawal (right). (F–I) TUNEL assay performed on PGCs cultured with bFGF and 24 h after bFGF withdrawal (J) Number of apoptotic cells after bFGF withdrawal (*significant difference between treatments; p<0.01). Statistical analyses were conducted with a Student's t-test (C and J) or ANOVA using SAS software (D).

