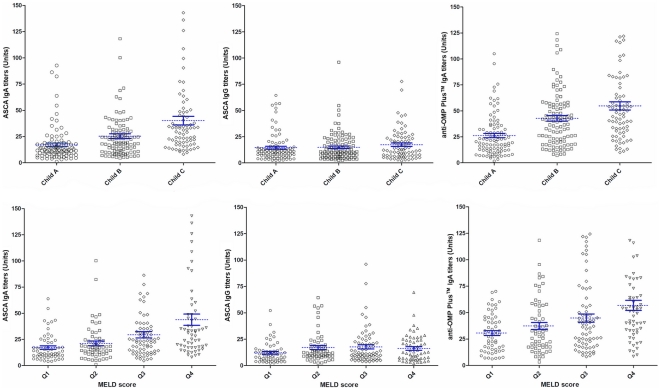
Figure 1. Anti-microbial antibody levels in patients with cirrhosis with various levels of severity, as depicted either by Child-Pugh stages (A) or MELD score (B).
A. Individual values are shown by black spots. Mean values with standard error bars are indicated in blue. Cut-off values for positivity are 25 Units for all antibodies. P<0.001 between all groups by ANOVA post hoc Scheffe for ASCA IgA and anti-OMP Plus™ IgA P = NS for ASCA IgG. B. MELD Q1-Q4 represent the groups of patients broken down by quartile: quartile1 patients have the lowest severity up to quartile4, representing patients with the highest level of severity. P<0.001 between all groups by ANOVA post hoc Scheffe for ASCA IgA and anti-OMP Plus™ IgA P = NS for ASCA IgG.

