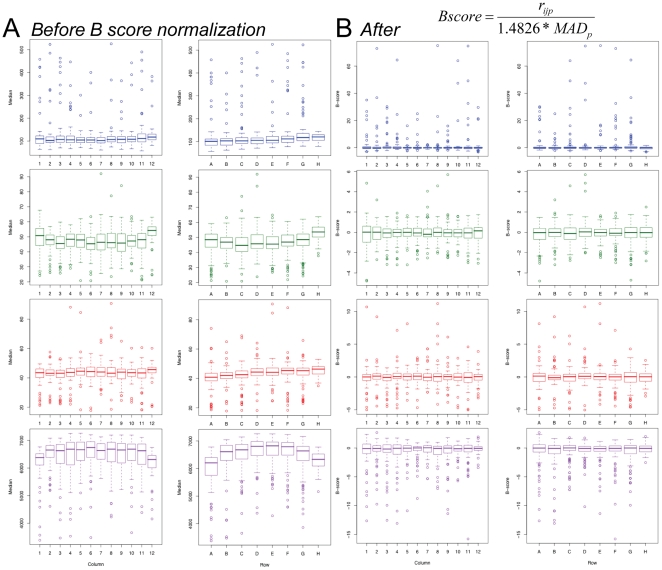
Figure 2. Correction of systematic row and column biases in 96-well format high-throughput data using a B score transformation.
(A) Overall column and row effects on medians of multiple parameters. The overall bias is shown for measurements of nuclear intensity (Hoechst; blue box plots), insulin expression (green), pdx1 expression (red) and cell number (purple). Box plots represent intraquartile range (IQR) with the dark line representing the median. Whiskers represent 1.5*IQR and outliers are any values exceeding that. (B) These systematic biases are corrected using a B score transformation. Overall column and row effects on cell measured after B-score transformation. Box plots for nuclear intensity (Hoechst; blue box plots), insulin (green), pdx1 (red) and cell number (purple). Box plots represent IQR with the dark line representing the median. Whiskers represent 1.5*IQR and outliers are any values exceeding that.

