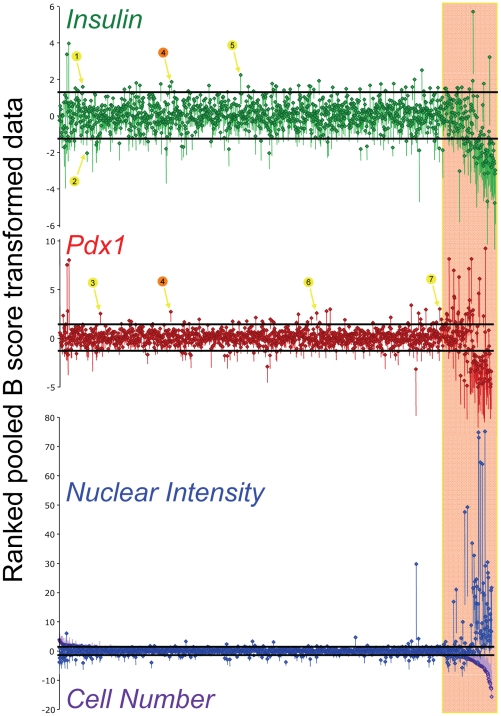
Figure 3. Results from multi-parameter high-content screening of marine invertebrate extract library.
B-score normalized values are shown for insulin activity (green), pdx1 activity (red), nuclear DNA staining intensity (blue), and cell number per well (purple). In each panel, the extracts are ranked according to their effect on cell count (bottom panel). Data are from five independent screens conducted on the MIN6 beta-cell line. Black lines around the center median indicate the median +/− 2*(Median Absolute Deviation; MAD), a measure of the spread of the data, analogous to the standard deviation. Hits (numbered circles and arrows) were defined as any extract whose SEM fell outside of the range of the median +/− 2*MAD. DMSO controls have been omitted from the data. Images with obvious artifacts (e.g. fibers) were omitted from data analysis.

