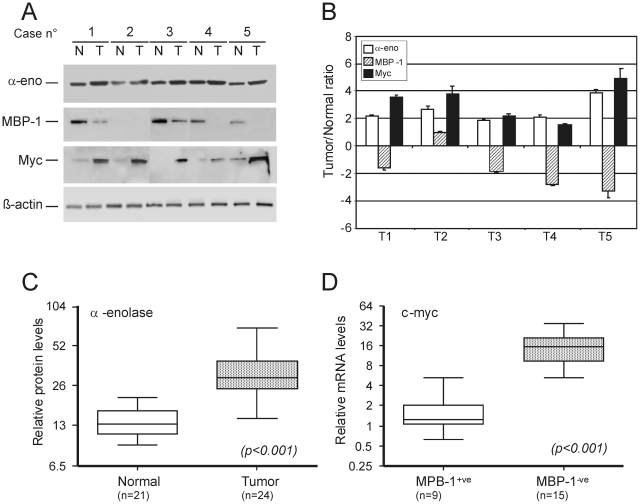
Figure 1. Relative expression of α-enolase, MBP-1 and Myc in primary breast tumors and adjacent normal tissue.
A. Representative Western blot analysis of α-enolase (α-eno), MBP-1, Myc and β-actin proteins in total lysates (30 µg) from breast tumors (T) and normal-matched tissues (N) was performed as described in materials and methods. B. Graphic representation of the averaged tumor/normal (T/N) ratios of α-enolase (white bars), MBP-1 (striped bars) and Myc (black bars) protein expression quantified by the densitometric analysis of Western blot results. Expression levels were normalized to β-actin. Columns are the mean of three parallel experiments; bar, ±SD. C. α-Enolase protein levels in normal and breast cancer tissues. The Box plot represents the α-enolase/β-actin ratio determined in 24 breast tumors and 21 normal-matched tissues. Significantly higher levels of α-enolase were present in breast cancers than normal tissues (t-test value, p<0.001). D. Myc mRNA expression levels in normal and breast cancer tissues. Transcripts were analyzed by real-time PCR and normalized with respect to TBP mRNA. Box plot of c-myc mRNA levels in MBP-1-positive (+ve) and negative (−ve) breast tumors. Myc mRNA levels are significantly associated with MBP-1 status (t-test value p<0.001). In C and D bars above and below the boxes represent the maximum and minimum expression. Each box delineates the first to third quartiles of expression, and the central bar represents the median.

