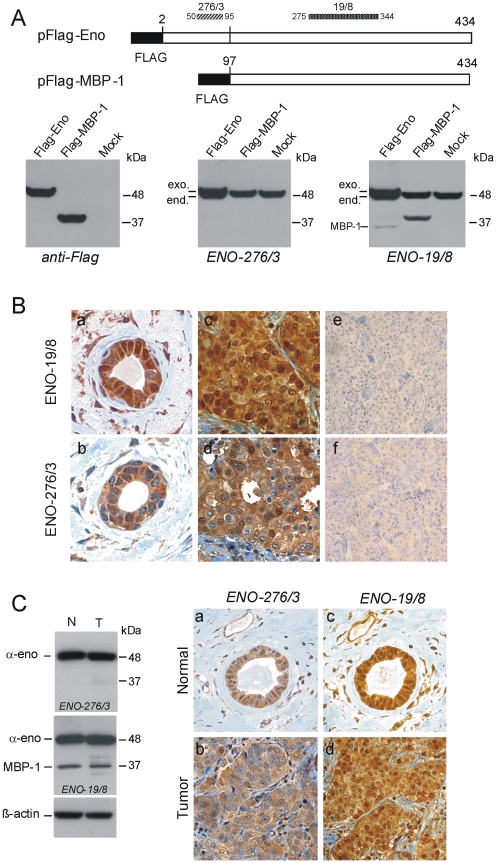
Figure 2. Monoclonal antibodies ENO-276/3 and ENO-19/8 specifically recognize α-enolase or both α-enolase and MBP-1.
A. Top, schematic representation of Flag-tagged constructs used, black boxes indicate the position of the Flag epitope, and numbers indicate the first and last amino acid in each construct. Protein regions containing the epitopes recognized by ENO-276/3 and ENO-19/8 mAbs are indicated by striped and dotted bars respectively, numbers refer to corresponding amino acids in the α-enolase sequence (Swiss-Prot: P06733). Bottom, Western blot analysis of 293T cells transiently transfected with vectors expressing Flag-tagged α-enolase (Flag-Eno), or MBP-1 (Flag-MBP-1) proteins, compared to mock transfected cells (mock). Cell lysates (20 µg) were firstly probed with polyclonal anti-Flag antibodies and, after stripping, the same filter was reacted with anti-α-enolase ENO-276/3, and finally with ENO-19/8, as indicated. Molecular weight (kDa) are indicated on the right. Relative positions of endogenous (end.) and ectopically expressed (exo.) α-enolase and MBP-1 from transfected pFlag-ENO are indicated on the left. B. Representative immunohistochemical staining on serial sections of a normal mammary tissue (a and b) and an IDC tumors sample (c and d) from the commercial TMA. The anti-α-enolase mAbs ENO-19/8 specifically decorated both nuclei and cytoplasm, while ENO-276/3 gave an almost exclusive cytoplasmic staining. As a control, breast cancer sections (e and f) were immunoassayed with mAbs which had been previously coincubated and thereby blocked with antigenic peptides, as described in materials and methods. Magnification: 500× (a–d), and 200× (e and f). C. Representative Western blot and immunohistochemical analyses of normal and tumor tissues from IDC samples. Left, Western blot detection of α-enolase (α-eno) and MBP-1 proteins in total lysates (30 µg) from a breast tumor sample (T) and normal-matched tissue (N) using mAbs ENO-276/3 and ENO-19/8. Anti-β-actin antibodies were used as a control for loading. Right, immunohistochemical staining with mAbs ENO-276/3 and ENO-19/8 of serial sections of the tumor (b and d) and the corresponding normal breast tissue (a and c) from the same sample analyzed by Western blot. Magnification: 400×.

