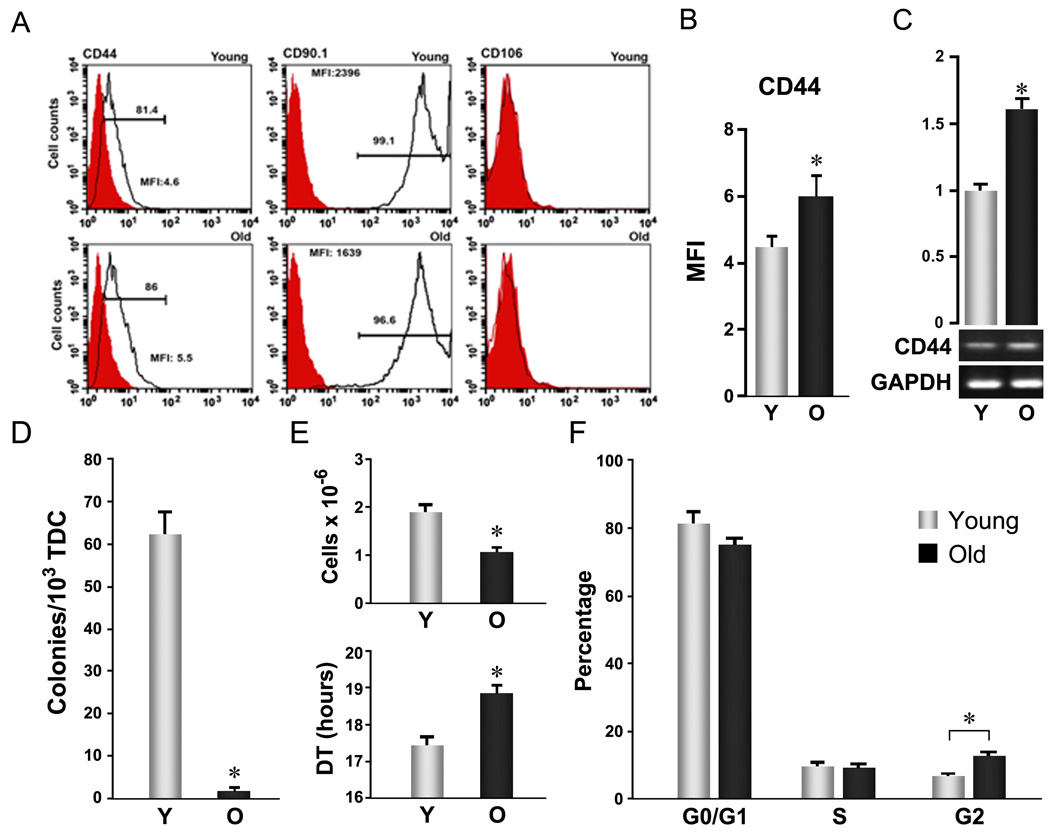
Figure 1. Aging-related cellular changes in TSPC self-renewal.
Young and aged TSPCs were prepared, as described by Bi et al (Bi et al. 2007), from 3–4 and 24–26 month Sprague-Dawley male rats, respectively. Patellar tendons were digested with collagenase A/dispase (2 h, 37 °C) and cultured in DMEM plus 10% FBS for 7–9 days. Adherent cells (passage 0, P0) at the end of culture were used as TSPCs for all assays unless otherwise specified. (A–C) Age-related surface antigen expression changes in TSPCs. A: Representative histogram plots. TSPCs stained with fluorescein-conjugated anti-rat antibodies (open) or isotype control antibodies (filled) were analyzed by FACS. B: Mean fluorescence intensity of CD44 based on FACS analysis of surface expression as shown in A (n=3, independent experiments, *P<0.05). C: CD44 mRNA levels determined by RT-PCR. Upper Panels represent the quantification of band intensity from the gel shown in lower panels. (D) Colony formation. Total tendon-derived cells (TDC) were plated at 1×10³ cells/well (6-well plate) and grown for 9 days. Colony forming units (CFUs) were scored after methylene blue staining. Error bars represent SD (n=3, *P<0.05 versus aged TSPC). (E) Proliferation. TSPCs were seeded at 1×10³ cells/well (6 well plate) and cultured for 8 days. Cell numbers were counted and cell population doubling times were estimated from start (0) and end (1) points. Error bars represent SD (n=3, *P<0.05 versus aged TSPC). (F) Cell cycle distribution. TSPCs were fixed with 70% ethanol, stained with propidium iodide (PI), and analyzed by FACS. Error bars represent SD (n=3 independent experiments; * P<0.05)

